


[029] Oxyhemoglobin dissociation curve (GB#104D03) | 基礎医学教育研究会(KIKKEN)Lab

● To release oxygen is also a task.
Hemoglobin is well known as a molecule that binds to oxygen O2. However, carrying and delivering oxygen to the necessary places is a job, so hemoglobin must also have the ability to obviously release oxygen. The biggest factor determining whether hemoglobin captures or releases oxygen is, of course, the concentration of oxygen around hemoglobin. When the surrounding oxygen concentration is high, hemoglobin binds oxygen and releases it when the oxygen concentration is low. This seems to be a natural story. However, hemoglobin has a clever cliff that has advanced one step. It is a graph called oxygen dissociation curve that well represents it.
—
Contents
- 1 ● Depending on the concentration of oxygen around it, sticking and getting away
- 2 ● Dissociation curve draws S-shaped curve
- 3 ● Hemoglobin gets full with alveoli
- 4 ● Responds sensitively to oxygen deficiency
- 5 ●As carbon dioxide increases, it becomes easier to release oxygen
- 6 ● Shifts to the right even when it gets hot
- 7 ※ [Experiment]
- 8 ○ Related articles
- 9 ○ Referenced books
● Depending on the concentration of oxygen around it, sticking and getting away
 Dissociation means that the objects that were bonded are separated. The dissociation curve shows how the oxygen O2 bound to hemoglobin leaves as a change in quantity. Normally, the oxygen dissociation curve shows the proportion (percent) of hemoglobin (oxygenated hemoglobin, oxyhemoglobin) that binds oxygen among the total amount of hemoglobin in the environment on the vertical axis of the graph, in other words the “binding rate” , or “oxygen saturation” is taken, while on the horizontal axis the concentration of oxygen in the environment is taken. However, the horizontal axis of the actual graph is not used much for the numerical value of oxygen concentration (mg/L, etc.). It is common to express in units of mmHg the unit of oxygen partial pressure (which seems to use the word oxygen tension in English) which is easy to control directly in experiments. It seems that the partial pressure expressed in units of mmHg is now old, but it is still in use for a while in Japan. (In the new display use unit Torr. The numerical value does not change.)
● Dissociation curve draws S-shaped curve
When the amount of the maternal to be bound, such as hemoglobin, is constant, it is limited to a certain range that the binding rate sensitively changes according to the change in the concentration of the substance bound to the matrix. When the concentration exceeds this range the change in the coupling ratio becomes dull. This is not particularly limited to hemoglobin, it is a simple property commonly manifested in biochemical reactions. Speaking of a simple story, if all the hemoglobin binds oxygen molecules, it is 100%, there is no reason to increase the binding amount beyond that. Successfully, it would be a gas exchange method that used the range of hemoglobin reaction well.
● Hemoglobin gets full with alveoli
 The important point is that while the oxygen binding rate changes sensitively in the peripheral tissues depending on the oxygen environment, it is almost 100% stable in the lungs.
The reason is that when the oxygen partial pressure becomes higher than 80 mmHg, the binding rate of hemoglobin exceeds 95%, but the oxygen partial pressure in the alveolar where the capillary in the lung exchanges gas is enough because it is constant at around 100 mmHg. Therefore, even if it does not have 100 mmHg, it can fluctuate even at 90 mmHg or 95 mmHg, but in this range, the oxygen binding rate is almost 100% anywhere no matter what.
That? The inhaled air has more oxygen, is not it? For those who are interested and a little more, the oxygen partial pressure in the atmosphere is 150 mmHg, but the inhaled fresh air and the air from the alveolus go in and out of the same thin tube. Besides, the air to be discharged is not completely discharged, and a certain amount always remains in the lungs. Therefore, they mix in the bronchus and alveoli. Even if you just inhale, the carbon dioxide partial pressure is 40 mmHg by the carbon dioxide CO2 collected from the body inside the alveolus, which is tens of times higher than the inhaled air. On the other hand, the oxygen partial pressure is lower than the atmospheric pressure by 30% or more. Oxygen in the alveolar is sucked up by the venous blood of the capillary wrapped around, but if the oxygen partial pressure exceeds 80 mmHg, the oxygen binding rate of hemoglobin will almost become full. Therefore, in the end, the oxygen partial pressure in the alveoli has settled down to almost 100 mmHg. That is, as long as you continue your normal breathing, the oxygen partial pressure of the alveoli is high enough. So, hemoglobin will soak in oxygen as much as possible (more than 99% of binding rate) and will pass away.
(* See ↓ experiment)
● Responds sensitively to oxygen deficiency
The oxygen satiated hemoglobin returns to the heart once again and is sent out through the artery from there to the whole body. As the artery progresses more and more branches and becomes thinner, the concentration of oxygen and carbon dioxide in the blood remains almost unchanged until it comes to the terminal capillary. The oxygen partial pressure of the arterial blood is almost 100 mmHg (exactly 98 mmHg or more?). Even though the gas diffuses through the cell membrane, it is obstructed by the tightly surrounding muscular layer and the connective tissue layer, so that in the artery the gas does not easily escape outside.
But as soon as blood reaches the capillary, things change completely. The muscular layer disappears, it becomes only a single layer of endothelial cells, and the surrounding wall becomes easy to pass.For tissues around the capillary, the oxygen partial pressure is lower than 40 mmHg. Oxygen is always lacking due to cellular activity. Oxygen molecules leave the wall of the blood vessel at a stretch from hemoglobin in the capillary due to this oxygen partial pressure drop.
It is surprising that at 40 mmHg, which is the peripheral oxygen partial pressure in textbooks, the binding rate is around 70%, and there are still more oxygenated hemoglobin. However, this graph is about the upper limit value ignoring the influence of the change in the concentration of carbon dioxide gas in the surroundings, and the coupling rate sensitively changes depending on the activity state of the tissue. When the oxygen partial pressure is lower than 50 mmHg, the oxygen dissociation curve of hemoglobin shows a sharp change in the binding rate to partial pressure change. In response to a slight decrease in oxygen partial pressure, more oxygen molecules leave the hemoglobin. When the oxygen partial pressure becomes about 20 mmHg, the bonding ratio is about 20%. The fact that oxygen partial pressure is low means that the oxygen demand is accordingly high, so using this range of dissociation curve is very reasonable.
●As carbon dioxide increases, it becomes easier to release oxygen
As the carbon dioxide is generated from the tissue cells, the partial pressure of carbon dioxide is 46 mmHg, which is slightly higher than the 40 mmHg in the arterial blood at the same time as the oxygen is thin (40 mmHg). Therefore, carbon dioxide diffuses into the capillary. An increase in carbon dioxide in the blood due to an increase in further cellular activity also affects hemoglobin. (The standard dissociation curve is in an environment with a carbon dioxide partial pressure of 40 mmHg in arterial blood.) In environments rich in carbon dioxide, hemoglobin becomes difficult to combine with oxygen. That is, even if the oxygen partial pressure is the same, if there is much carbon dioxide, it becomes easier to release oxygen. When comparing at the same oxygen partial pressure, the oxygen dissociation curve can be pushed down by the influence of carbon dioxide. This effect appears more intensively the lower the oxygen partial pressure, but it decreases when the oxygen partial pressure is high. This is also to say that the entire curve shifts to the right (lower right) rather than lowering the curve due to the influence of carbon dioxide.

The higher the cell activity in the periphery, the higher the oxygen demand and the more carbon dioxide is generated. So it also makes sense that the dissociation curve shifts to the right as carbon dioxide increases. As carbon dioxide increases, free hydrogen ions increase by that amount, and blood and body fluids tend to be acidic. Even if blood is tilted to acidity for reasons other than carbon dioxide, the dissociation curve shifts to the right. This shift due to an increase in hydrogen ion is called the Bohr effect, and the influence of carbon dioxide is due to the Bohr effect.
● Shifts to the right even when it gets hot
Even when the temperature rises, hemoglobin becomes easy to release oxygen. Not only when exercising but also generally, as cellular activity rises energy release will increase somewhat and the temperature will rise, so this is also a reasonable property.
※ [Experiment]
In the experiment, a breath holding experiment was carried out using an oxygen saturation meter at hand, a pulse oximeter (Nippon Kohki oxyparmini SAT-2200). Then, the oxygen saturation with the left index finger originally 99% began to fall from about 1 minute past breath-hold and reached 91% in 2 minutes.
Breathing was restored soon, but despite the saturation level, it continued to fall further and dropped to 85% over about 20 seconds. After that, it quickly recovered to more than 95%. The time lag may be due to the arrival time of the blood flow from the lung to the fingertip. Therefore, at the end of the breath holder, it seems that the oxygen binding rate decreased to 85% or less due to a decrease in the oxygen partial pressure of the alveolus and an increase in the carbon dioxide partial pressure. Ignoring the influence of carbon dioxide, it is estimated that the oxygen partial pressure decreased to around 60 mmHg when the bonding ratio is 85%. While the oxygen partial pressure in the alveolus seems to decline in proportion to the time almost immediately after stopping breathing, it takes much longer than 20 seconds for the oxygen saturation to begin to decline, and as soon as respiration is restored The change that comes back to the original is the way the hemoglobin dissociation curve shows itself.
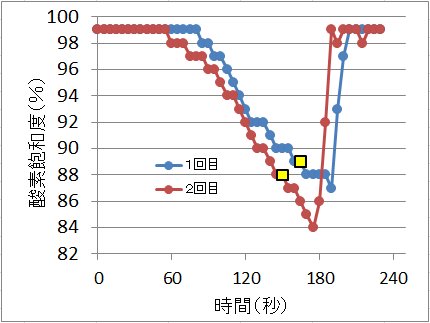
The breath stopped until the point of yellow marker and then resumed immediately thereafter.
○ Related articles
◆[023] 赤血球とヘモグロビン erythrocyte and hemoglobin ![]()
◆[011] Body acid-base reaction and carbon dioxide gas ![]()
◆[010] Alveolar ventilation and dead space ![]()
◆[016] 血液循環 blood circulation ![]()
◆[001] Heartbeat pumping ![]()
◆[037] 膠質浸透圧 colloid osmotic pressure ![]()
◆[046] Digestion and metabolism ![]()
◆[050] Cellular respiration ![]()
○ Referenced books
・プロッパー細胞生物学,化学同人
・Essential細胞生物学〈DVD付〉原書第3版,南江堂
・細胞の分子生物学, ニュートンプレス; 第5版 (2010/01)
・肉単―ギリシャ語・ラテン語 (語源から覚える解剖学英単語集 (筋肉編))
・カラー図解 人体の正常構造と機能 全10巻縮刷版,坂井 建雄,日本医事新報社
・人体機能生理学,杉 晴夫,南江堂
・トートラ人体解剖生理学 原書8版,丸善
・イラスト解剖学,松村 讓兒,中外医学社
・柔道整復学校協会編「生理学」,南江堂
・東洋療法学校協会編「生理学」,医歯薬出版株式会社
rev.20141230,rev.20160507,rev.20170505, rev.20171217, rev.20180331.
KISO-IGAKU-KYOIKU-KENKYUKAI(KIKKEN)